Having a well structured and reusable api-led architecture is a key factor to deliver a successful product to your customer, but also implementing a common monitoring system that sends alerts when some of your api fails can make the difference between a good and a great solution.
In this article we will show how to set up a monitor that periodically check if ours mule apps are healthy leveraging Anypoint Monitoring feature.
Introduction
In order to achieve our goal we should add a couple of new endpoint to each apps, this endpoints will provide information about the status of the apps and of its dependencies. This solution will add the following endpoints to each app of our system:
-
heartbeat – check the status of the api only.
-
healthcheck – check the status of the api and its dependencies.
RAML Configuration
We will use a RAML fragment to defines once the data type we will use across ours api:
#%RAML 1.0 Library
usage: Healthcheck utility datatypes
types:
  heartbeat:
    description: A data type to for the heartbeat
    properties:
      status:
        enum:  ["healthy","unhealthy"]
        required: true
      serviceName:
        type: string
        required: true
      type:
        enum:
          - xapi
          - papi
          - sapi
          - backend
        required: true
      message:
        type: string
        required: false

  healthcheck:
    description: A data type to checkes health-check of its dependecy
    type: heartbeat
    properties:
      dependencies:
        type: array
        items: heartbeat
        required: false
Once the library is defined and published on Anypoint Exchange we can add the monitoring endpoint to ours api.
First import the exchange module in your main raml file:
uses:
monitoring-lib: exchange_modules/.../healthcheck-library.raml
Then add to your main RAML file the heartbeat and healthcheck endpoints based on your api type:
- System API: heartbeat
- Process API: heartbeat + healthcheck
- Experience API: healthcheck
/healthcheck:
  displayName: Health Check
  get:
    displayName: Health Check
    description: Returns the status of the API and its dependencies
    responses:
      200:
        body:
          application/json:
            type: monitoring-lib.healthcheck
            example: !include exchange_modules/.../healthcheck-example.json

/heartbeat:
  displayName: Heartbeat
  get:
    displayName: heartbeat
    description: Returns the status of the API
    responses:
      200:
        body:
          application/json:
            type: monitoring-lib.heartbeat
            example: !include exchange_modules/.../heartbeat-example.json
Implementation
Now let’s see how we can implement a common flows that can be used across our apis to implements the monitoring endpoints defined above, in this example we will use Mule 3 but it can be easily adapted to Mule 4 also.
Heartbeat subflow
Inside your common module implement a simple SubFlow that will return infos about the status of the api
It’s a really simply flows that return info of the called api:
-
status: healthy (if is unhealthy it will no respond at all)
-
serviceName: taken from property app.name (this property is always available and you don’t have to worry about different name for the same api for different environment)
-
type: sapi/papi/xapi calculated from the app.name using a dataweave function (explained later)
Healthcheck subflow
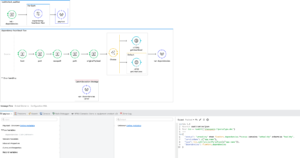
Use a for-each scope to cycle the dependencies passed as input payload and for each one invoke the corresponding heartbeat/healthcheck api (this can be configured from the api referencing this flow, explained later)
Use a choice to be able to work with both HTTP and HTTPS request, the http request configuration use flow vars to dynamically call endpoint on different hosts, port and path
<http:request-config
    name="HTTPS_Request_Configuration_hearthbeat"
    host="#[flowVars.host]" port="#[flowVars.port]"
    doc:name="HTTP_Request_Configuration_hearthbeat"
    basePath="#[flowVars.basePath]" protocol="HTTPS">
	<tls:context>
		<tls:trust-store insecure="true"/>
	</tls:context>
</http:request-config>

<http:request-config
    name="HTTP_Request_Configuration_hearthbeat"
    host="#[flowVars.host]" port="#[flowVars.port]"
    doc:name="HTTP_Request_Configuration_hearthbeat"
    basePath="#[flowVars.basePath]" />
Create a Dataweave function used by both heartbeat and healtcheck subflow to determinate the api-led layer of the current api from its name.
Use a regex and assume that the api name follow one of this 2 standard:
-
somewhere in the api name there a char sequence of this types
-
-s- for system api
-
-p- for process api
-
-e- for experience api
-
-
somewhere in the api name there a char sequence of this types
-
-sapi- for system api
-
-papi- for process api
-
-xapi- for experience api
-
%dw 1.0
%function parseType(serviceName)
"sapi" when serviceName matches /(.+-s-.+|.+-sapi-.+)/ otherwise
"papi" when serviceName matches /(.+-p-.+|.+-papi-.+)/ otherwise
"xapi" when serviceName matches /(.+-e-.+|.+-xapi-.+)/ otherwise "unknown type"
---
{
callFunctionParseType: parseType
}
Once your common module is complete build it as a .jar file and install it in your maven repository in order to be able to import it in the project where you want to enable monitoring.
Monitored projects
Heartbeat
For the heartbeat flow it is enough to put a flow reference to the heartbeat subflow of the common module.
HealthCheck
Add a dataweave transform message as first processor in your healthcheck flow:
Prepare the input payload creating an array of objects where each object represent a dependency of the project
- protocol: HTTP or HTTPS
- serviceName: the name of the dependency (used only id the service does not reply)
- host: the host of the dependency
- port: the port of the dependency
- basepath: the base path of the dependency
- path: can be “/heartbeat” or “/healthcheck” depending on how much you want to go deep in the dependencies tree
%dw 1.0
%output application/java
---
[
    {
        protocol:"HTTPS",
        serviceName:"dep_1_app_name",
        host:p("dep.1.host"),
        port:p("dep.1.port"),
        basepath:p("dep.1.base.path"),
        path:"/heartbeat"
    },
    {
        protocol:"HTTPS",
        serviceName:"dep_2_app_name",
        host:p("dep.2.host"),
        port:p("dep.2.port"),
        basepath:p("dep.2.path"),
        path:"/heartbeat"
    },
    {
        protocol:"HTTPS",
        serviceName:"dep_3_app_name",
        host:p("dep.3.host"),
        port:p("dep.3.port"),
        basepath:p("dep.3.path"),
        path:"/heartbeat"
    }
]
Add a flow reference after the transform message and reference this flow: “healthcheck_subflow”
Anypoint Monitoring Configuration
Log in on Anypoint Portal and launch Anypoint Monitoring.
From the left menu select “Functional Monitoring” and press “Create”.
Configure the Monitor with your heartbeat/health check endpoint and a proper assertion
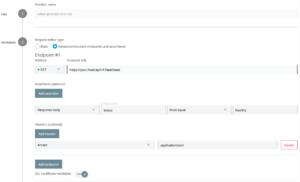
Finally choose the way you prefer to be notified in case of fail (Email, Slack, NewRelic, etc etc) and press “Create”.
Your monitor is now up & running and will periodically check the status of your apis.
Choose the right Location
Functional Monitor can be scheduled to run from internal or external Location. By Default each organization has a limited amount of external location available (5) while you can create as many internal location as needed, just keep in mind that internal location will use some of the cores of your organization license. For further details about the Monitor Location please che the official documentation
Author: Luca Piras